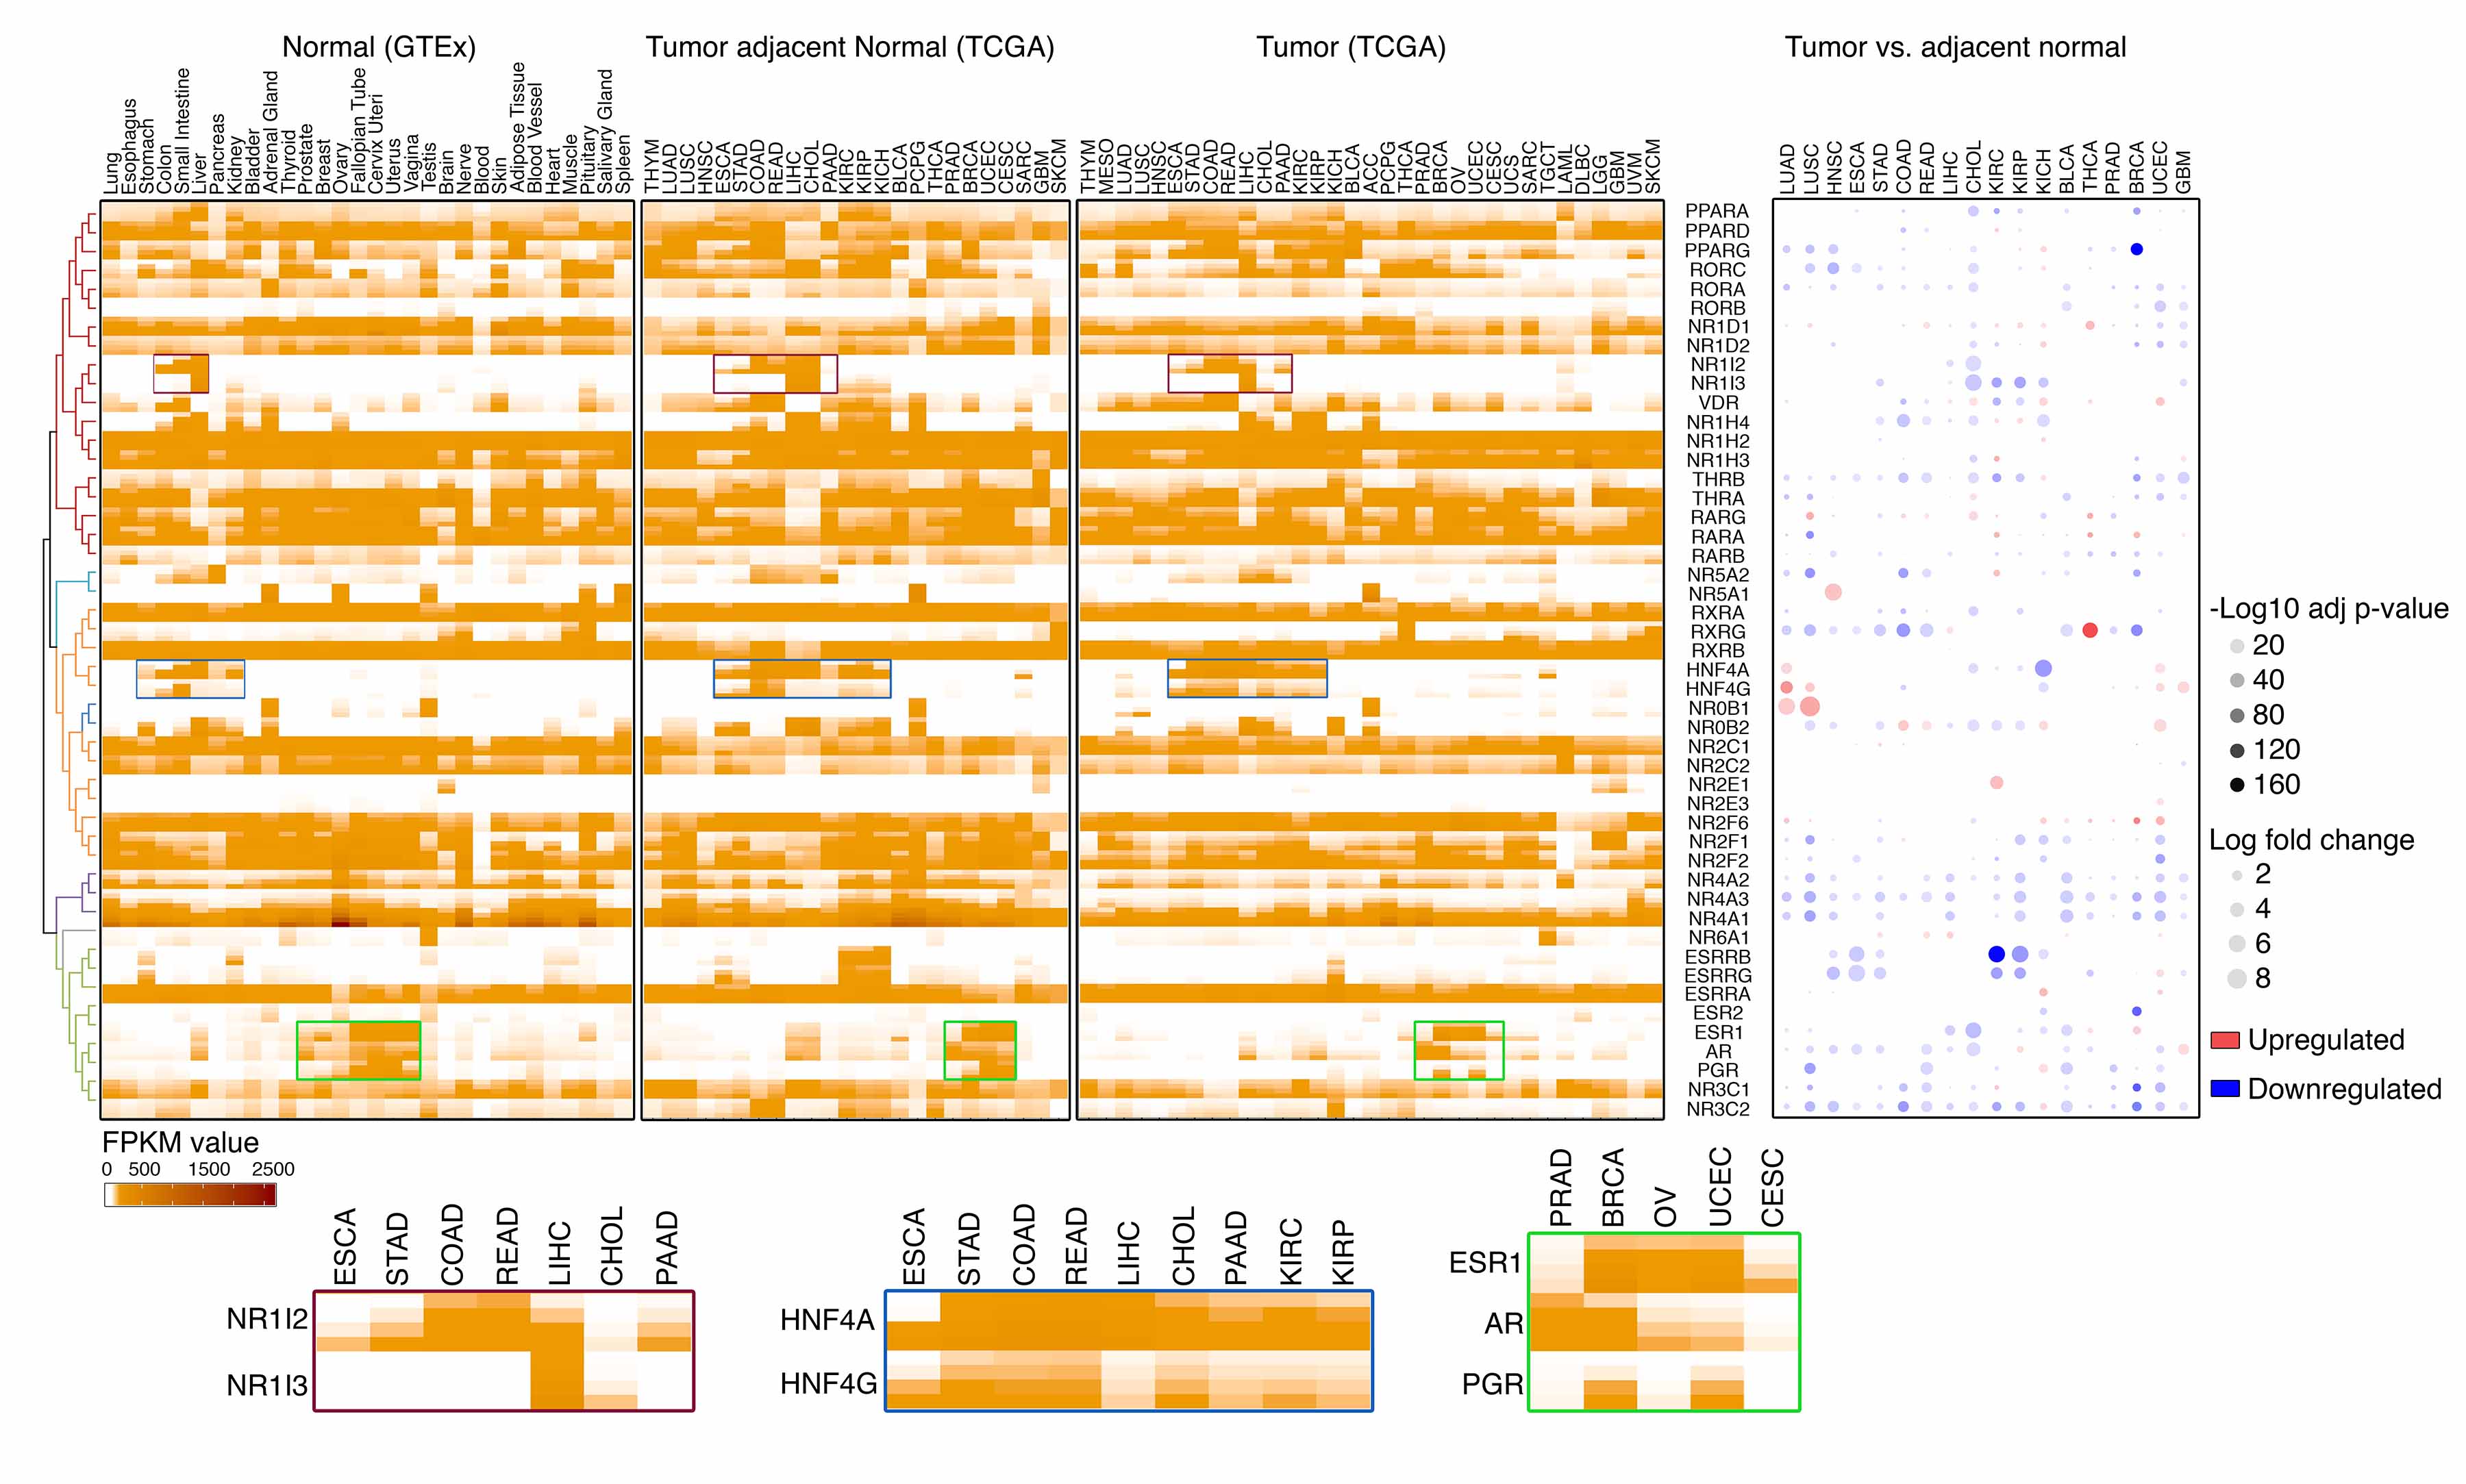
To characterize expression of NRs in cancers, we analyzed the RNA-sequencing (RNA-seq) profiles from the GTEx (n=7,792, with samples of 30 normal healthy tissues; Dataset 2) and TCGA (n=9,733, with tumor samples of 33 cancer types from 27 primary sites; Dataset 3). The RNA-seq data generated by both GTEx and TCGA were processed through a pipeline developed by the UCSC Toil RNAseq Recompute Compendium, which allowed us to consistently process large-scale RNA-seq data without computational batch effects. The NRs whose mRNA expression was detected in at least 10% of samples (the 90th percentile FPKM value > 1) in a given tissue/cancer type were defined as expressed in that tissue/cancer type (Figure 2A, Dataset 2 and 4). Approximate half of the NRs showed a cancer-type specific expression pattern across cancers, and 17, 10 and 5 NRs were identified as expressed in less than 20, 10 and 5 cancer types, respectively (Figure 2A and 2B). On average, more than 30 NRs were detectable in each cancer type but less than 5 of them showed high-level expression (the 90th percentile FPKM value >50, Figure 2C). Many NRs (e.g., NR1I2/NR1I3, HNF4A/HNF4G, and ESR1/PGR/AR) were highly and specifically co-expressed in the cancer types that derived from related tissue lineages. Although 19 NRs were ubiquitously detectable across cancers, most of them showed heterogenous expression behavior among different cancer types. For example, NR1D2 was detected in all cancers, while high-level NR1D2 expression was only observed in certain cancer types. To identify cancer type-specific NRs, a tissue specificity index (Tau) was also estimated for each NR across cancers. A total of 21 NRs showed specific expression patterns in cancers (Tau values>0.8; Figure 2D and Dataset 5) and NR1I3 was identified as the most cancer type-specific NR. Consistently, t-distributed stochastic neighbor embedding (t-SNE) analysis demonstrated that NR expression levels were able to distinguish tumor specimens from different cancer types. Tumor specimens from related tissue lineages were clustered together (Figure 2E). For example, tumors derived from women’s reproductive system (ovarian serous cystadenocarcinoma [OV], uterine corpus endometrial carcinoma [UCEC], cervical squamous cell carcinoma and endocervical adenocarcinoma [CESC], uterine carcinosarcoma [UCS] and breast invasive carcinoma [BRCA]) shared similar NR expression signatures. Finally, we compared NR expression among normal healthy tissues (GTEx), matched tumor adjacent normal tissues (TCGA,) and tumor specimens (TCGA). Although largely distinct patterns of NR expression were observed among the specimens with different lineage origins, NR expression patterns in tumors and their corresponding normal tissues were similar. The differential expression of NRs between normal and tumor specimens were further estimated in the cancer types whose adjacent normal controls are available in TCGA (n=18). Notably, among 391 significant differential expression events identified across cancers (adjusted p-value<0.05, log fold change>0.5), the majority of them (74.7%, 292/391) showed significant downregulation in tumors compared to their corresponding normal tissues (Dataset 6). The global downregulation of NRs was observed in all cancer types examined, and 44 of 48 NRs exhibited significantly decreased expression in at least one cancer type (Figure 2A). Taken together, the expression pattern of NRs in cancers is highly tissue-type specific, and their expressions are globally downregulated during tumorigenesis.


