
Summary of genetic ancestry of TCGA patients across 33 cancer types.
Each circle corresponds to the total sample number of a given cancer type, and the proportion of each genetic ancestry is indicated by color. European American: EA (green); African American: AA (blue); East Asian American: EAA (pink); Native American: NA (yellow); and Others: OA (grey). Note: to avoid confusion, we categorized genetic ancestry as EA, AA, EAA and NA, and self-identified race from TCGA as White, Black, Asian, and American Indians and Alaska Natives. A color-coded square indicates that the sample number of a given minor genetic ancestry group is larger than 30.
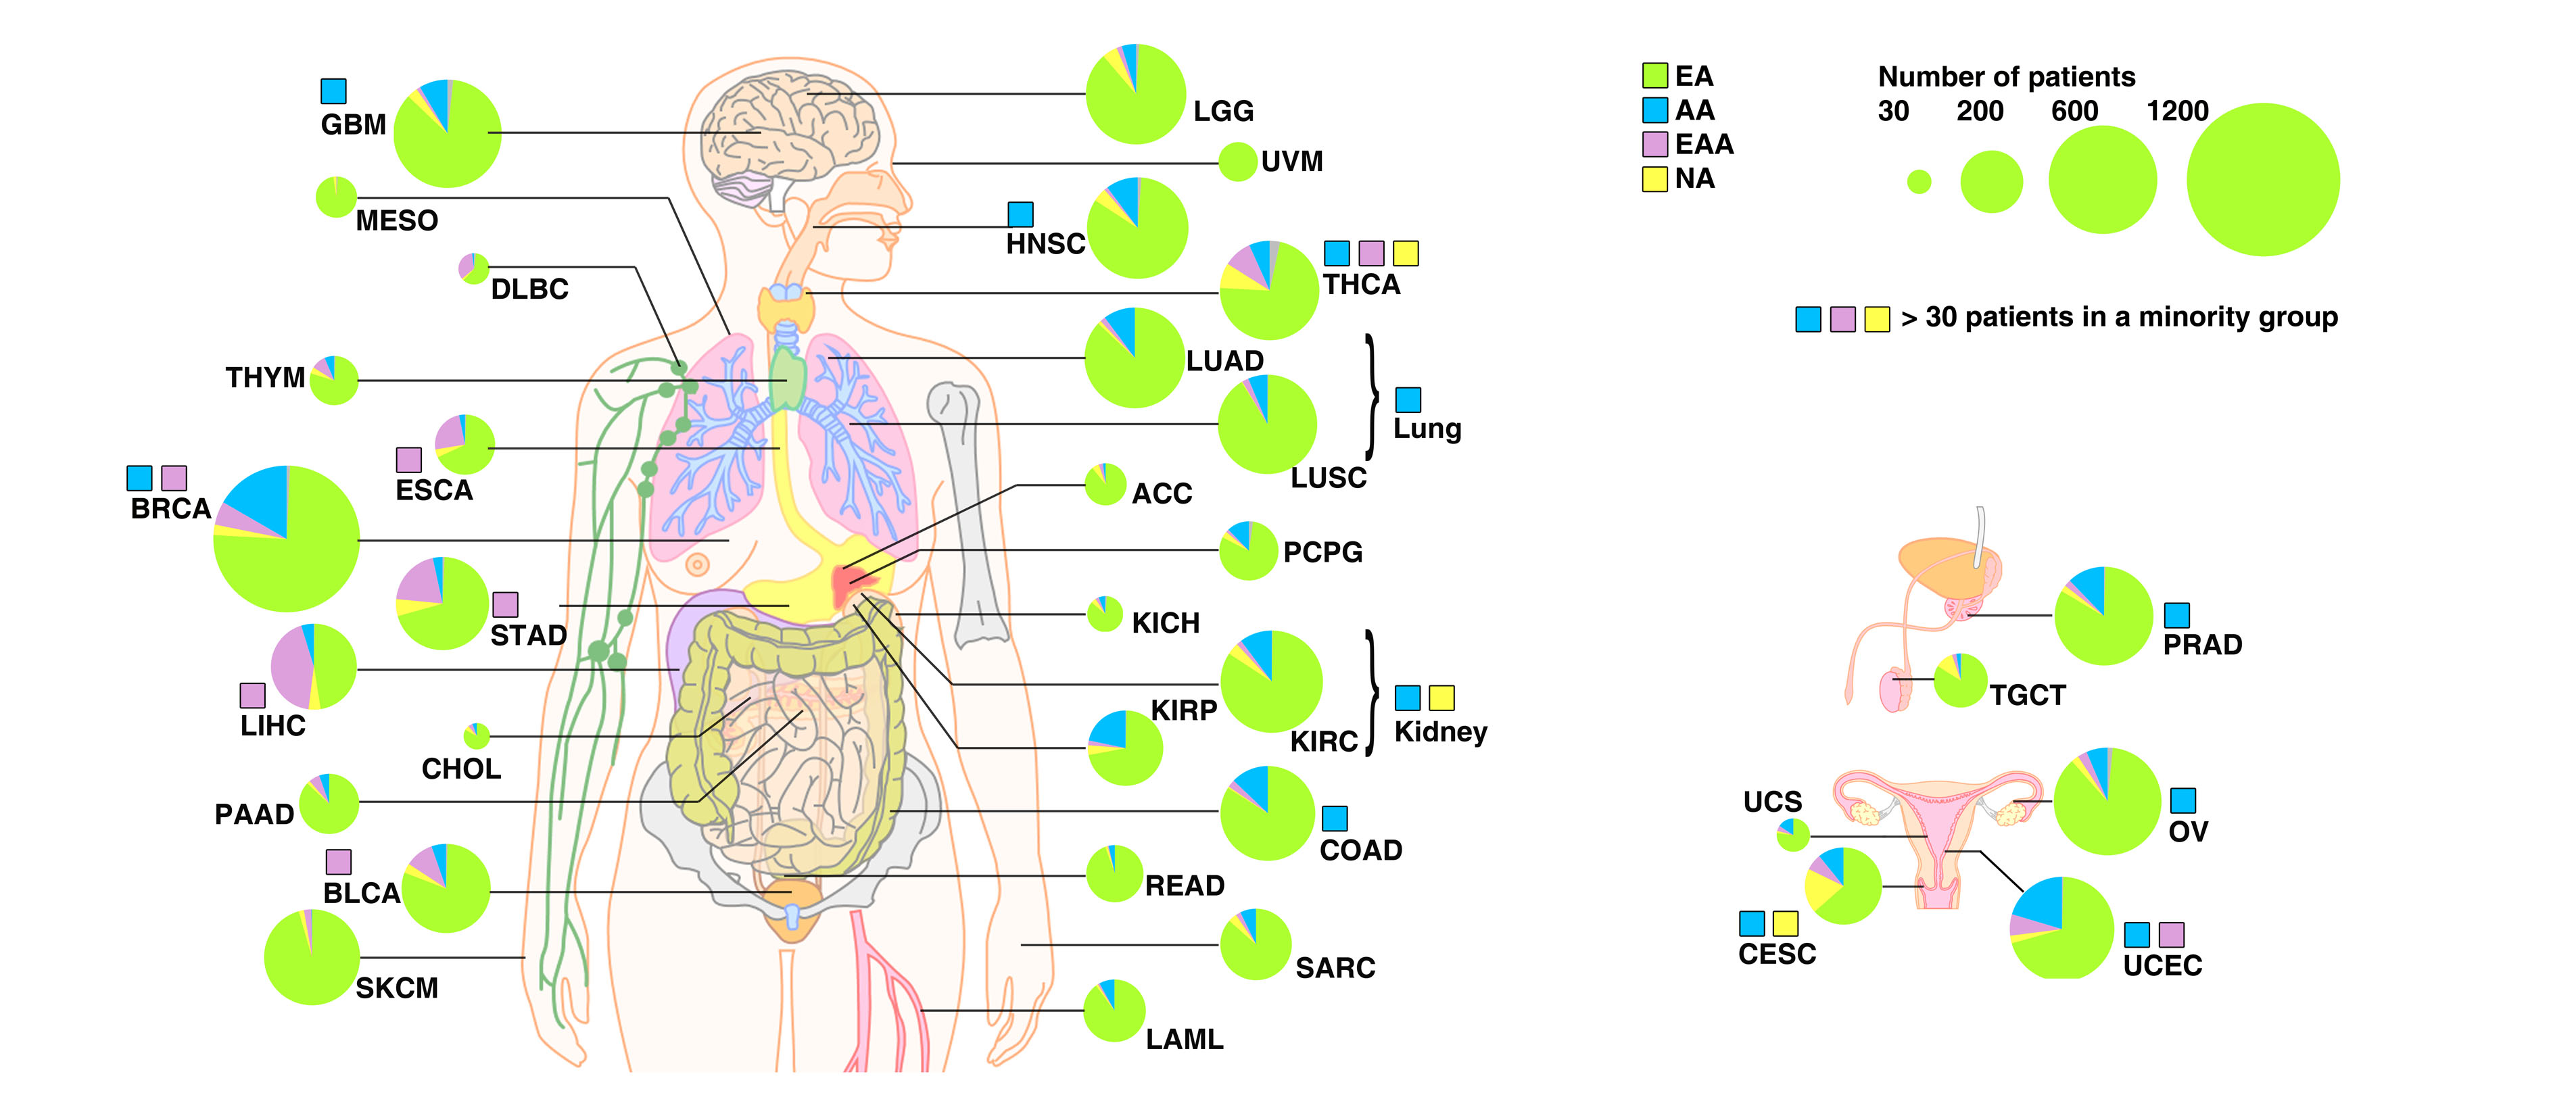
| Next |
Summary of genetic ancestry of TCGA patients across 33 cancer types.
Each bar corresponds to the total sample number of a given cancer type, and the proportion of each genetic ancestry is indicated by color. European American: EA (green); African American: AA (blue); East Asian American: EAA (pink); Native American: NA (yellow); and Others: OA (grey). Note: to avoid confusion, we categorized genetic ancestry as EA, AA, EAA and NA, and self-identified race from TCGA as White, Black, Asian, and American Indians and Alaska Natives.
| Previous | Back to top | Next |
Summary of genetic ancestry of TCGA specimens inferred by EIGENSTRAT.
Bar plot showing the numbers of TCGA patients categorized into each of four genetic ancestry groups (EA, NA, EAA and AA) as estimated by EIGENSTRAT across the TCGA cohort. SIRE information is color-coded by green (White), pink (Asian), blue (Black), orange (AI/AN), and gray (missing). The proportion of SIRE is also represented with a circle plot.
/Summary Fig S2.jpg)
| Previous | Back to top | Next |
Summary of genetic ancestry of TCGA specimens inferred by STRUCTURE.
Each color represents one of the ancestral reference groups. Each patient is represented by a column partitioned into different colors corresponding to the genetic ancestry composition. Patients are ordered following a hierarchical clustering by Wald’s methods on distance matrix calculated as cosine dissimilarity of genetic composition. SIRE and genetic ancestry categorization as estimated by EIGENSTRAT for each patient are shown in the same order at the bottom.
/Summary Fig S3.jpg)
| Previous | Back to top |
This site is hosted by the Department of Obstetrics and Gynecology at University of Pennsylvania.
Copyright © 2015 University of Pennsylvania. All Rights Reserved.