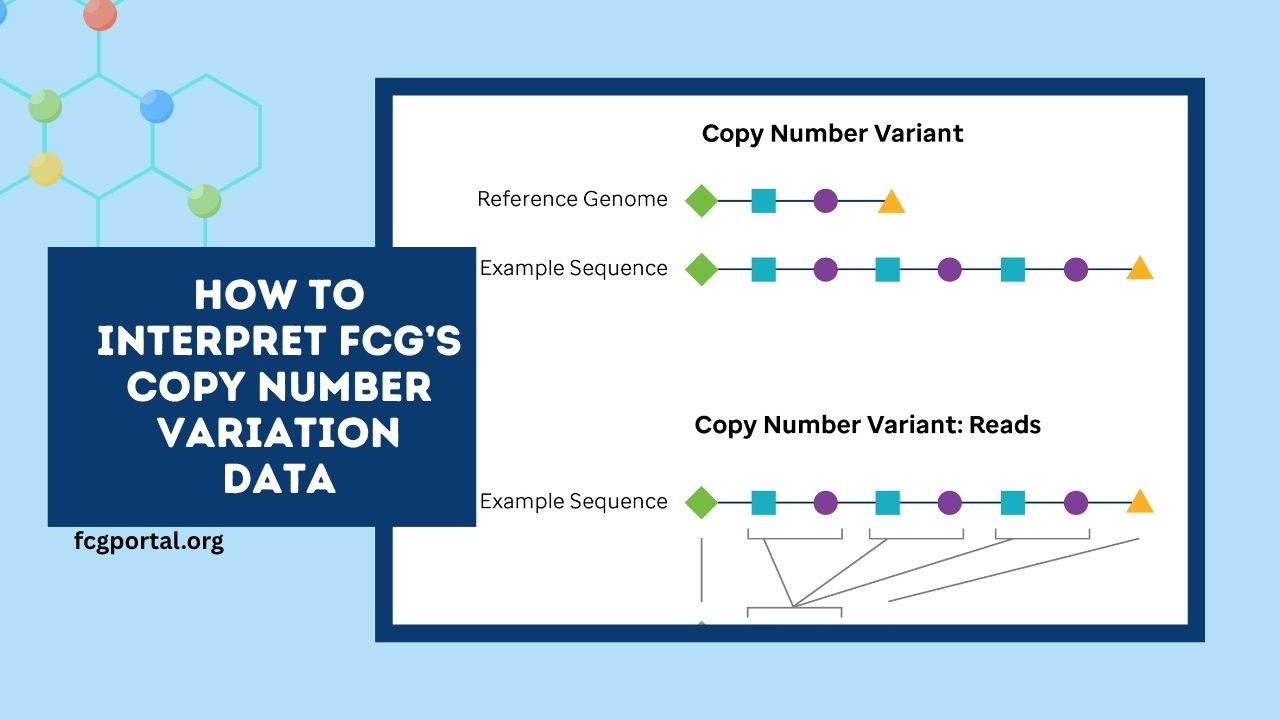
Copy Number Variation (CNV) analysis is a cornerstone of cancer genomics, revealing amplifications and deletions that drive tumor behavior.
The Functional Cancer Genome (FCG) Portal delivers robust CNV information drawn from TCGA datasets, enabling deeper understanding of genomic alterations.
Learning how to interpret these data is essential for both research and translational applications.
Understanding CNV Data in FCG
FCG’s CNV data typically originates from pipelines like ASCAT and ABSOLUTE, which infer integer copy numbers adjusted for tumor purity and ploidy.
These outputs reflect how many copies of a genomic segment exist in a tumor sample relative to a normal diploid baseline.
Alternatively, segmentation approaches using log₂ ratios (e.g., via DNAcopy/CBS) offer continuous measurements:
- A value of 0 indicates diploid status
- Positive values suggest gains/amplifications
- Negative values indicate
Key Elements When Interpreting CNV Data
| Element | Interpretation Guidance |
|---|---|
| CNV Call Type | Integer-based (e.g., 0, 1, 2, 3+) or log₂ ratio values—know which format FCG provides. |
| Baseline Reference | Comparison to normal diploid genome (baseline = 2) or segmented median. |
| Thresholds | Minor shifts (log₂ ±0.1) may be noise; threshold significance often requires ≥0.2–0.3 shifts. |
| Amplification vs Deletion | Positive (gain/amplification), Negative (loss/deletion). |
| False Positives | Low-level changes (e.g., log₂ ±0.1) are potential artifacts—not actionable markers. |
| Biological Context | High-level gains/deletions in oncogenes or tumor suppressors are most biologically relevant. |
Step-by-Step Guide to Interpretation
- Determine Data Format & Source
Identify whether FCG provides integer CNV calls (via ASCAT/ABSOLUTE) or segmented log₂ ratios. - Establish Baseline
Check whether the data is normalized to diploid baseline (2) or centered on zero. - Set Interpretation Thresholds
In log₂ data, minor deviations often reflect noise; focus on regions with significant shifts (e.g., >1 for amplification or <–1 for deletion). - Assess CNV Impact
Large-scale alterations affecting protein-coding genes—especially in known cancer drivers—are especially noteworthy. - Cross-Validate and Filter
Disregard low-confidence signals (like log₂ ±0.1). Confirm significant CNVs across multiple samples or cohorts. - Integrate with Other Datasets
Combine CNV findings with expression, methylation, or mutation data to evaluate functional relevance.
Why Proper CNV Interpretation Matters
- Noise Reduction: Filtering out artifactual CNVs ensures cleaner, more reliable genomic profiles.
- Clinical Relevance: High-confidence CNVs targeting oncogenes (e.g., MYC, HER2) may guide therapies or serve as biomarkers.
- Research Impact: Understanding CNV patterns across tumors aids in discovering recurrent genomic changes and potential therapeutic vulnerabilities.
Interpreting CNV data from FCG’s portal demands a firm grasp of data types (integer vs log₂), thresholds for significance, and genomic context.
When executed correctly, CNV insights empower researchers to pinpoint critical amplifications or deletions tied to cancer progression, opening new avenues for biomarker discovery and precision medicine.
FAQs
How do I distinguish between amplification and deletion in CNV data?
Positive integer calls or log₂ values above baseline indicate amplification, while negative values indicate deletions.
What thresholds define meaningful CNV changes?
Minor variations (e.g., log₂ ±0.1) often reflect noise; focus on larger shifts (log₂ >1 or <–1) for higher confidence.
Should all CNVs be considered clinically significant?
No—only high-confidence CNVs impacting key oncogenes or tumor suppressors merit clinical or biological consideration.