
Comparison of the prostate tumor non-coding transcriptome by genetic ancestry
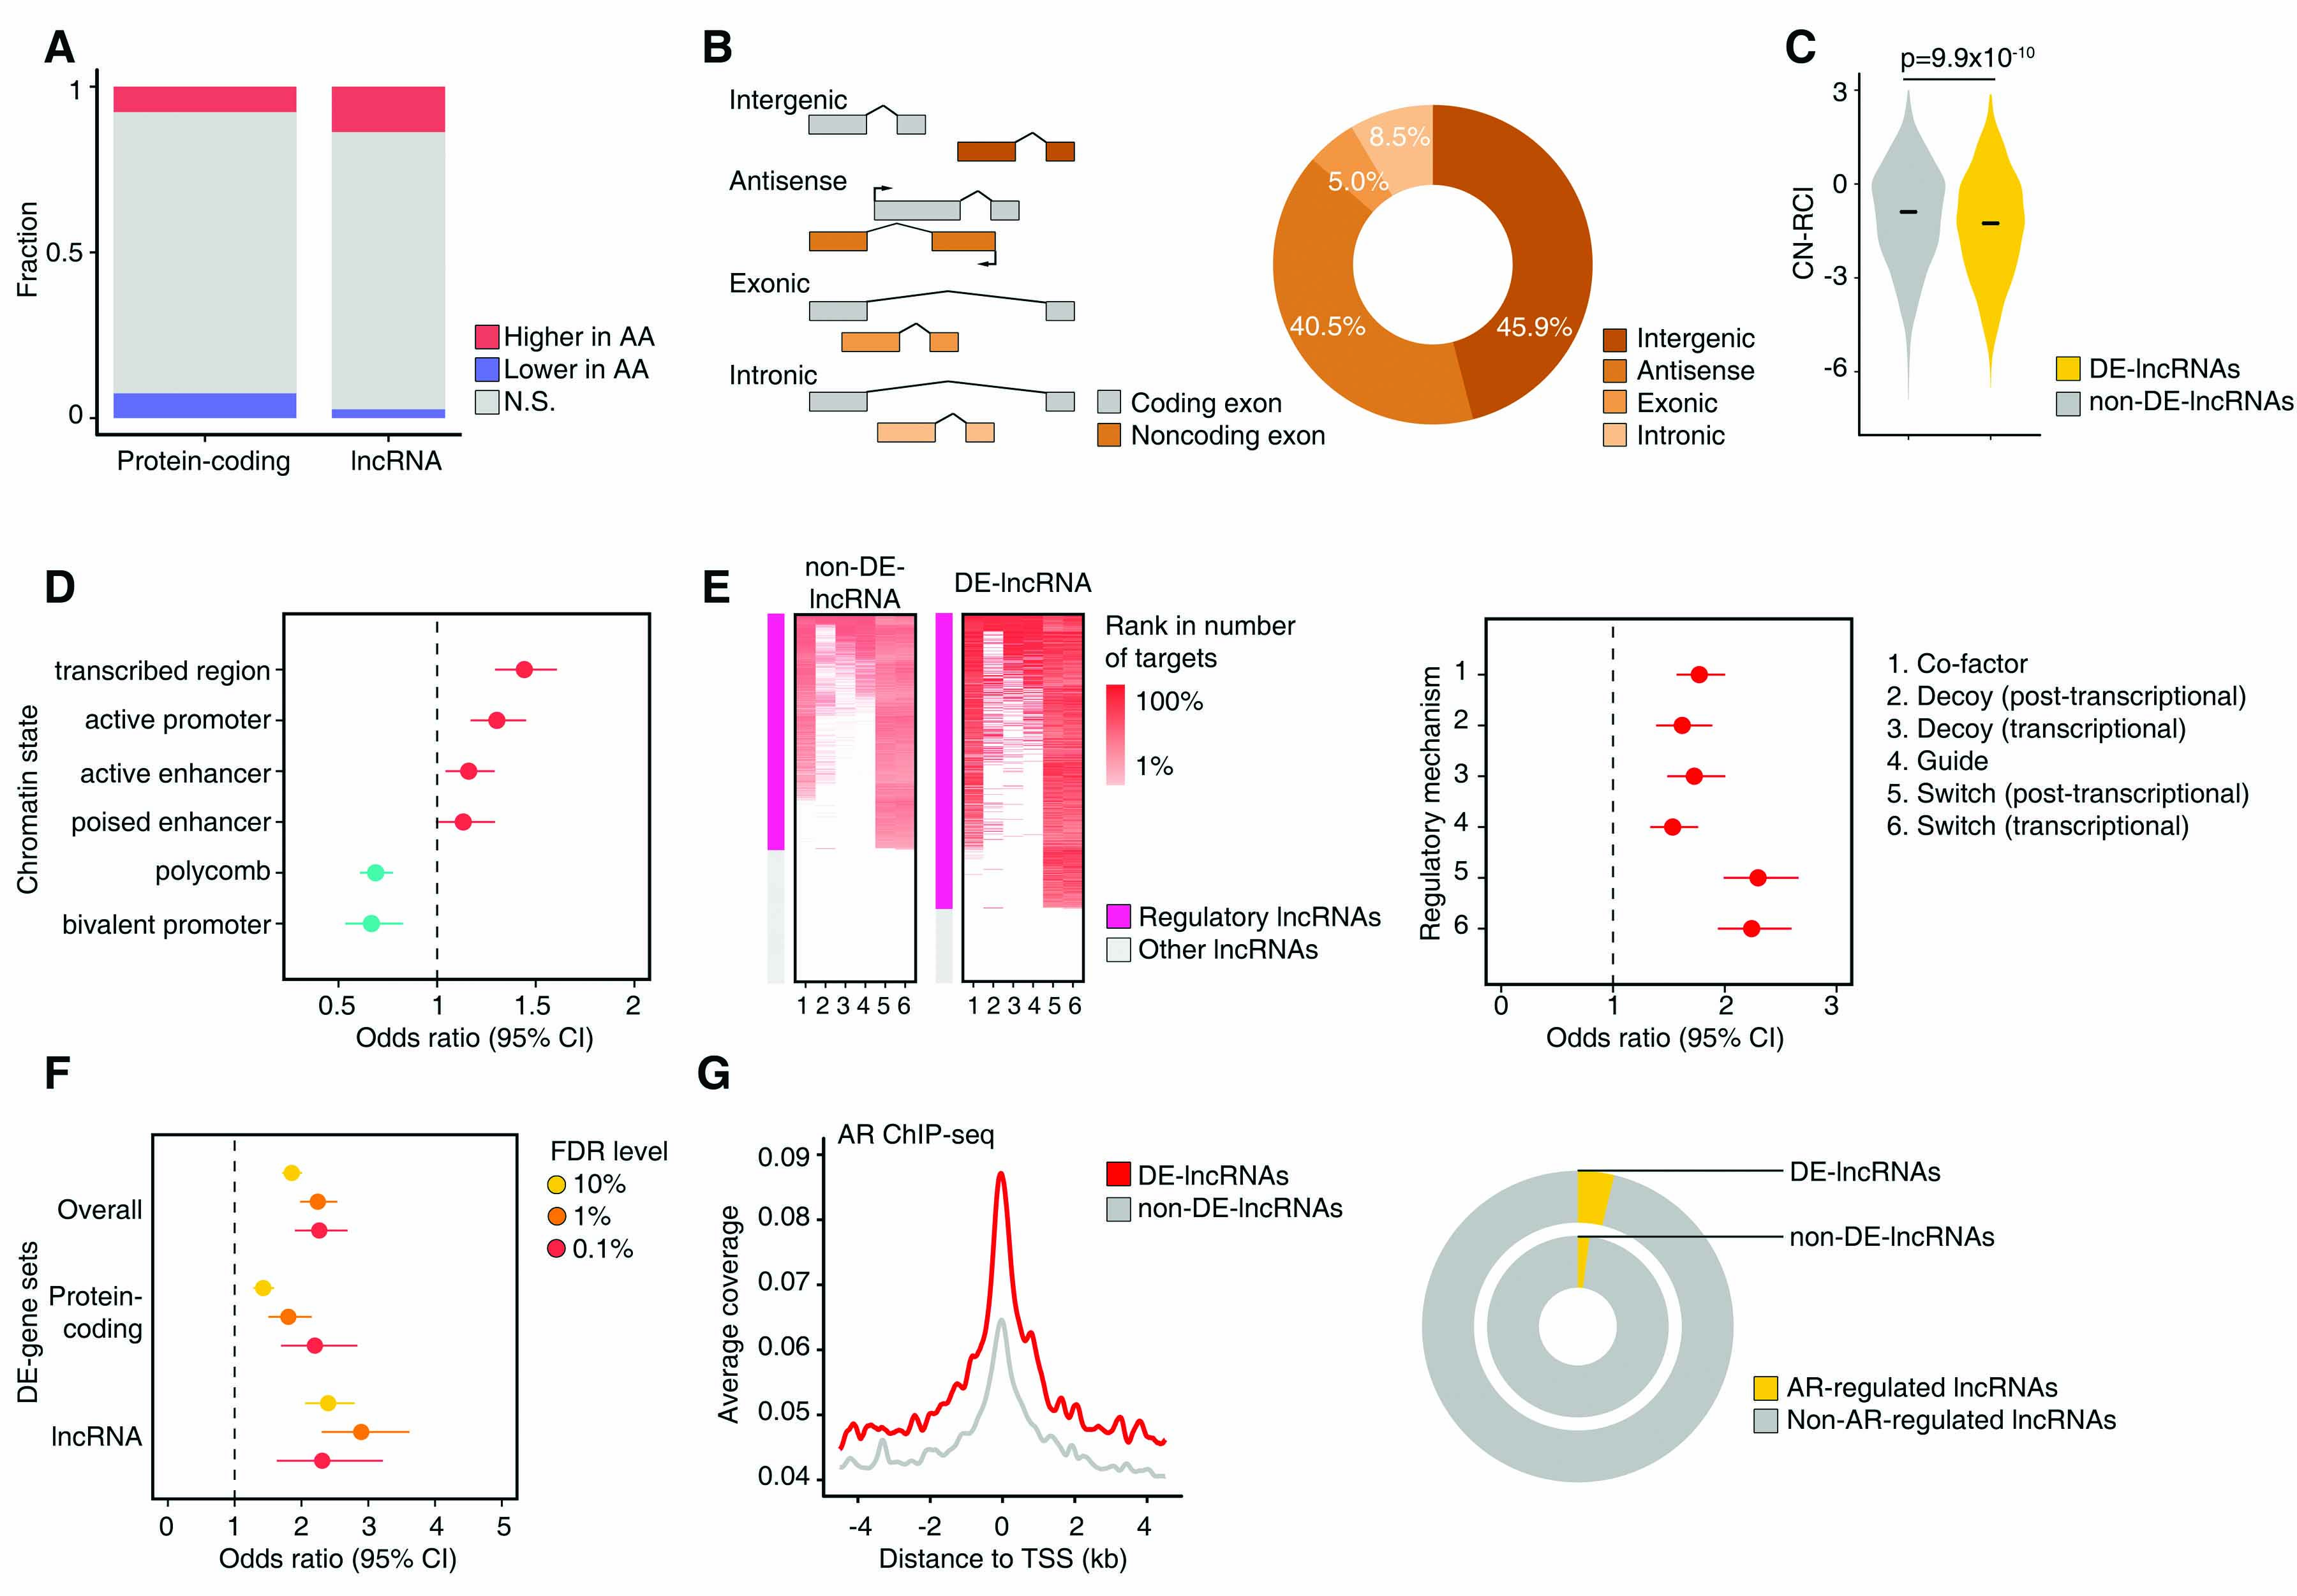
(A) Proportions of DE-protein-coding and DE-non-coding genes. Red indicates statistically significantly higher expression in AA, while blue indicates lower expression in AA. Width of bars is proportional to the number of genes. (B) Classification of lncRNAs by genomic location relative to protein-coding genes (left). Circle plot of distribution of DE-lncRNAs by lncRNA genomic location (right). (C) Distributions of cytoplasmic-nuclear relative concentration index (CN-RCI) for DE-lncRNAs and non-DE-lncRNAs. DE-lncRNAs are more enriched in the nucleus (lower CN-RCI). (D) Odds ratios and 95% confidence intervals (95% CI) of differential expression by genetic ancestry of lncRNAs by chromatin state of the genomic region. Chromatin state is estimated by ChromHMM partitioning of the LNCaP cell. (E) Heatmap displaying enrichment for regulatory lncRNAs among non-DE-lncRNAs and DE-lncRNAs by regulatory mechanism (left). Odds ratios (95% CI) of differential expression by genetic ancestry of lncRNAs by regulatory mechanism (right). (F) Odds ratios (95% CIs) of enrichment with genes regulated by normal prostate tissue eQTLs (eGenes) for DE-genes overall, DE-protein-coding genes, and DE-lncRNAs. Odds ratios are displayed by FDR level of the differentially expressed gene. (G) Average signals of AR binding at transcription start sites (TSSs) of DE-lncRNAs (red) and non-DE-lncRNAs (gray) from AR ChIP-seq data from VCaP cell (left). Circle plot showing proportion of AR-regulated lncRNAs among DE-lncRNAs and non-DE-lncRNAs (right). AR regulation was inferred by analysis of DHT-stimulated transcriptome.
Copyright © 2015 University of Pennsylvania. All Rights Reserved.