
Comparison of genomic alterations by genetic ancestry
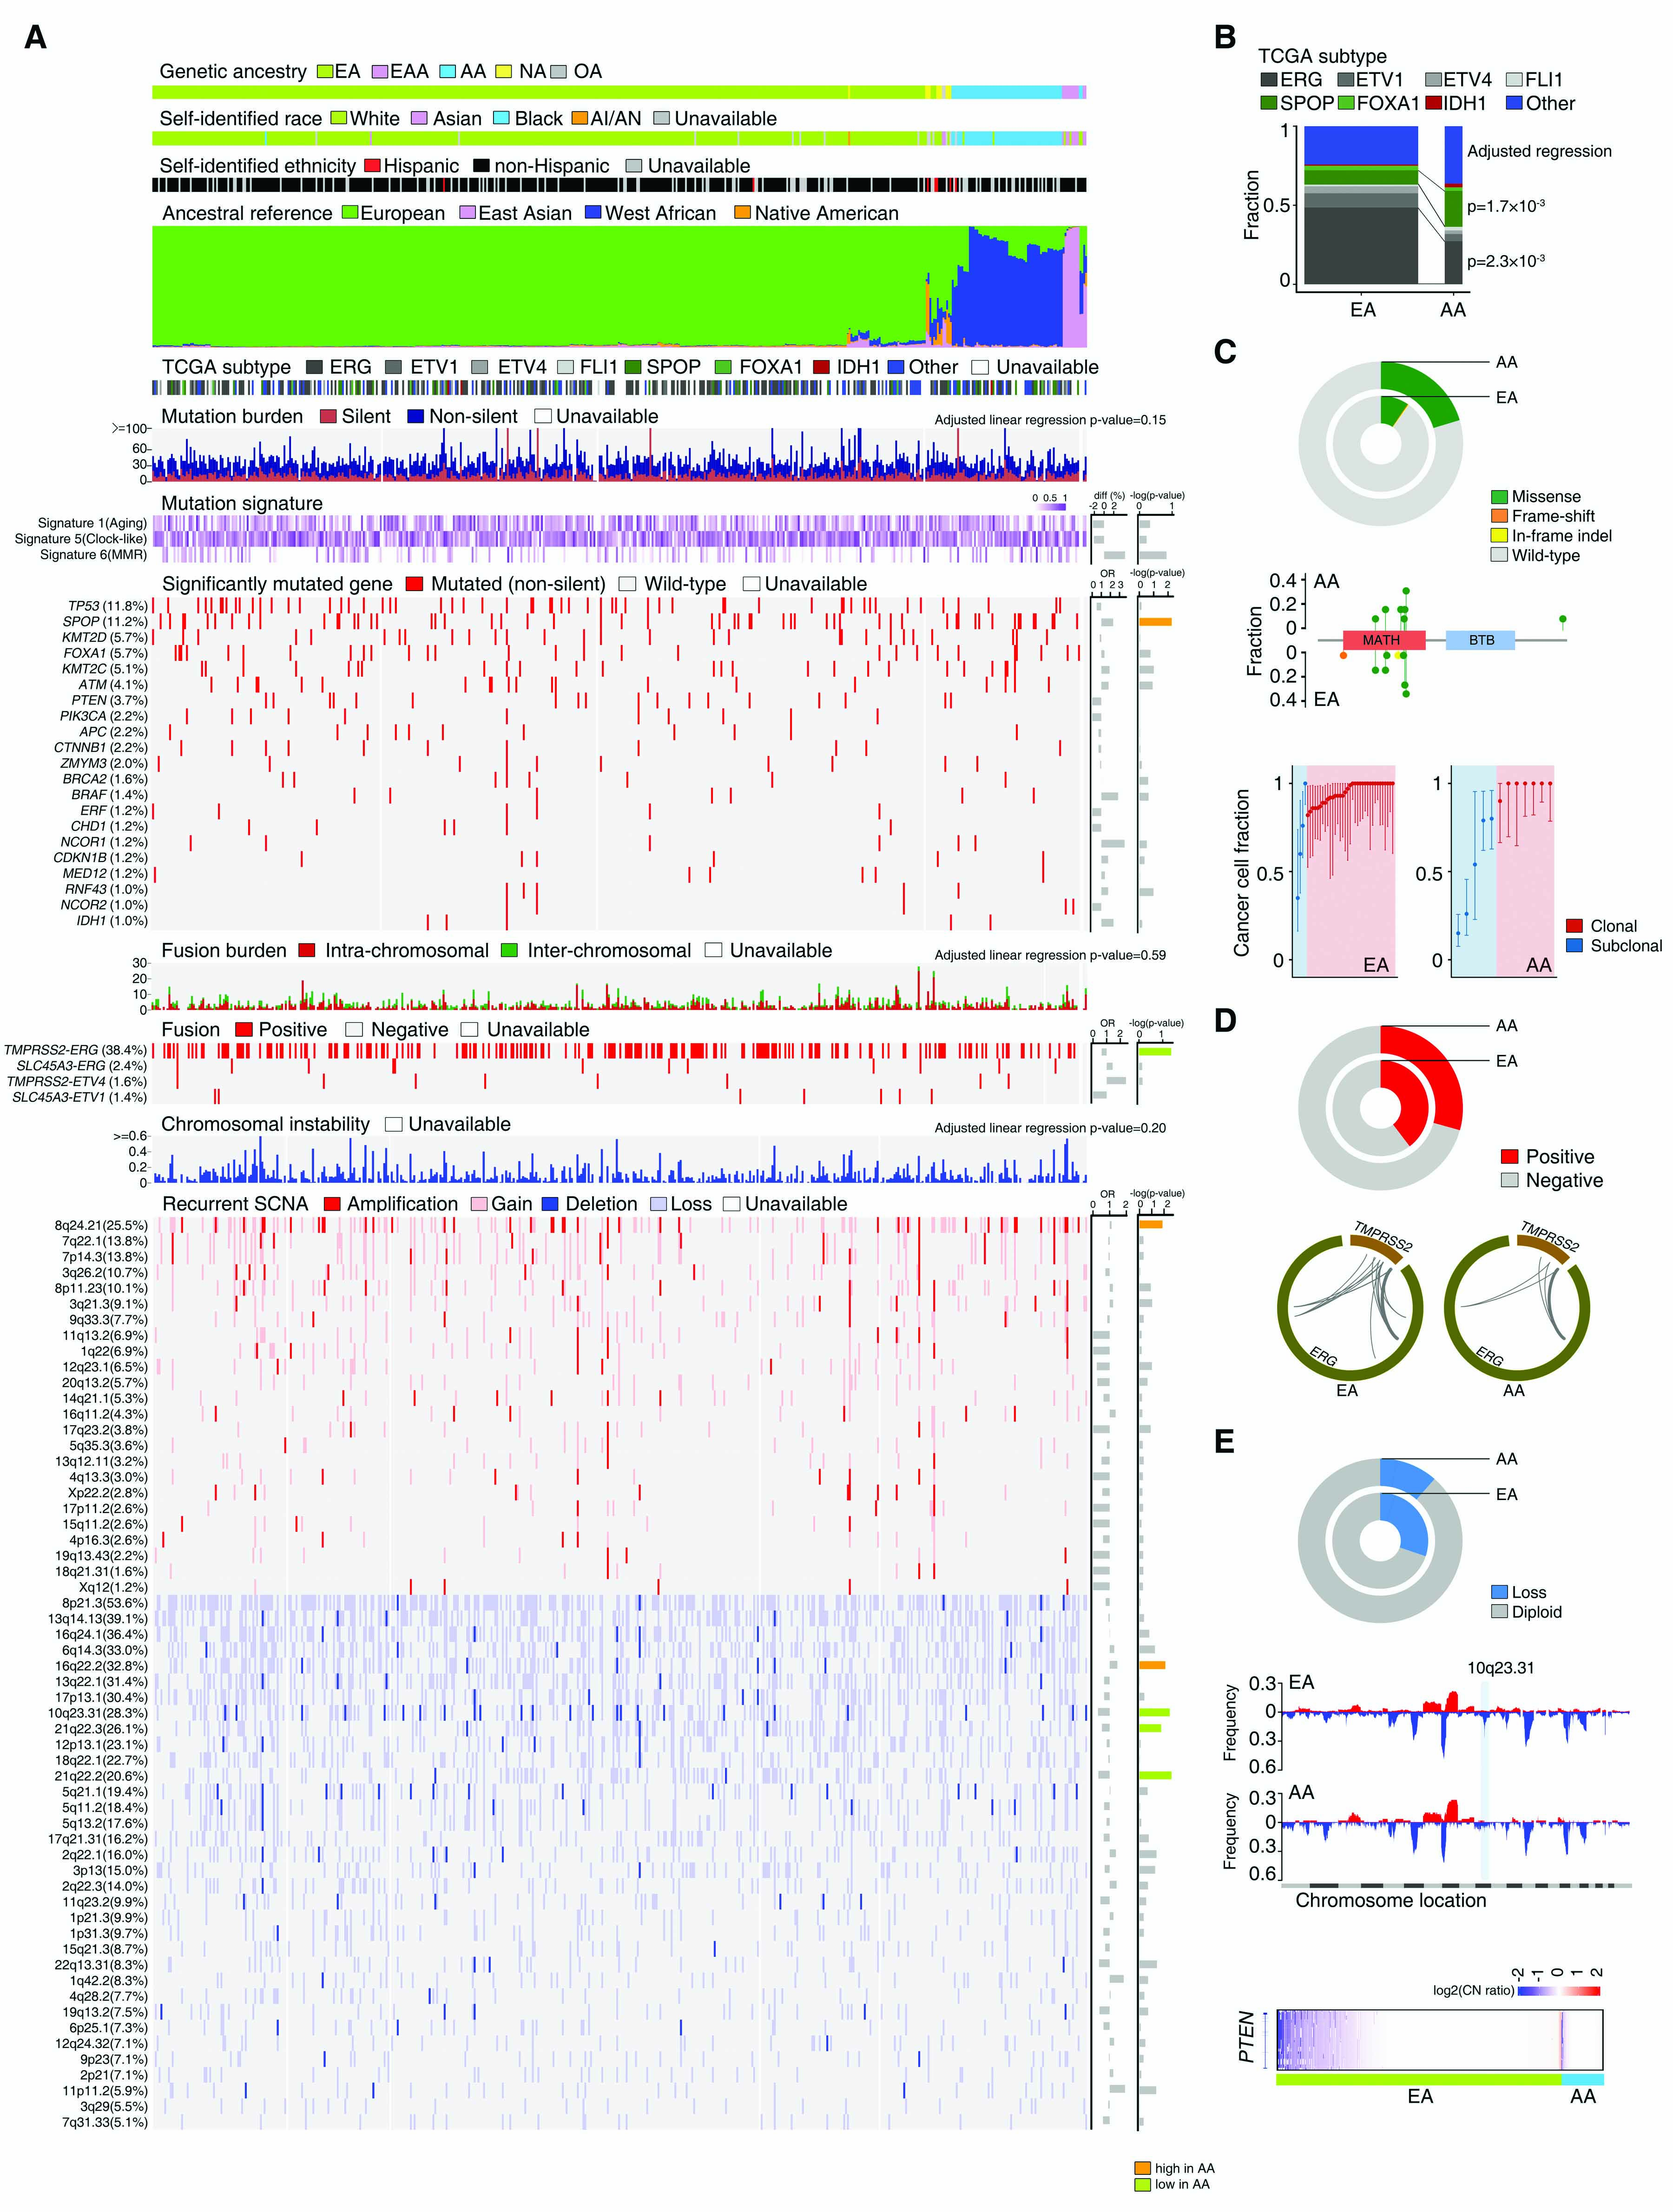
(A) Overview of genomic alterations by genetic ancestry in the TCGA CaP sample. The upper panels show patient genetic ancestry estimated by EIGENSTRAT, SIRE, and ancestral composition estimated by STRUCTURE. Middle panels show participant tumor molecular subtype, mutation burden, presence of mutation signatures 1, 5, and 6, and a heatmap of the mutation frequency at 21 specific genes with ≥1% mutation frequency in the sample. Lower panels show total fusion burden, a heatmap of the frequency of four gene fusions with ≥1% frequency in the sample, total chromosomal instability, and a heatmap of the frequency of 58 recurrent focal somatic copy number alterations (red: amplification/gain; blue: deletion/loss) in the sample. Odds ratios (OR) and differences (diff) compare genomic alteration frequency among men with AA ancestry relative to men with EA ancestry. –log(p-values) are color-coded as significantly more frequent in AA men (orange), significantly less frequent in AA men (green), or no significant difference between AA and EA men (gray). (B) Distributions of seven TCGA CaP molecular subtypes among men with AA and EA ancestry. Men with AA were more likely to have SPOP subtype tumors and less likely to have ERG subtype tumors. (C) Frequency (upper), location (middle), and clonality (lower) of SPOP mutations among men with AA and EA ancestry. SPOP mutations more frequently occurred in men with AA ancestry (upper). Mutations preferentially located in the MATH domain for men with both AA and EA ancestry. Mutations are color-coded by type: missense (green), frame-shift (red), in-frame insertion/deletion (yellow). Men with AA ancestry had a greater frequency of subclonal SPOP mutations than men with EA ancestry (lower). Red represents clonal mutations and blue represents subclonal mutations. (D) Frequency of the TMPRSS2-ERG fusion (upper) and distribution of gene breakpoint sites (lower) by genetic ancestry. The TMPRSS2-ERG fusion was more prevalent among men with EA ancestry, although breakpoint site patterns were similar among men with EA and AA ancestry. (E) Copy number deletions and losses at 10q23.31 were more common among men with EA ancestry than with AA ancestry (upper). The lower prevalence of 10q23.31 loss for AA men is evident when viewing copy number alterations across the genome (middle). Greater focus on the PTEN locus indicates that PTEN loss is less common among men with AA ancestry (lower).
Copyright © 2015 University of Pennsylvania. All Rights Reserved.