
Genetic ancestry and clinical characteristics of the TCGA prostate cancer population
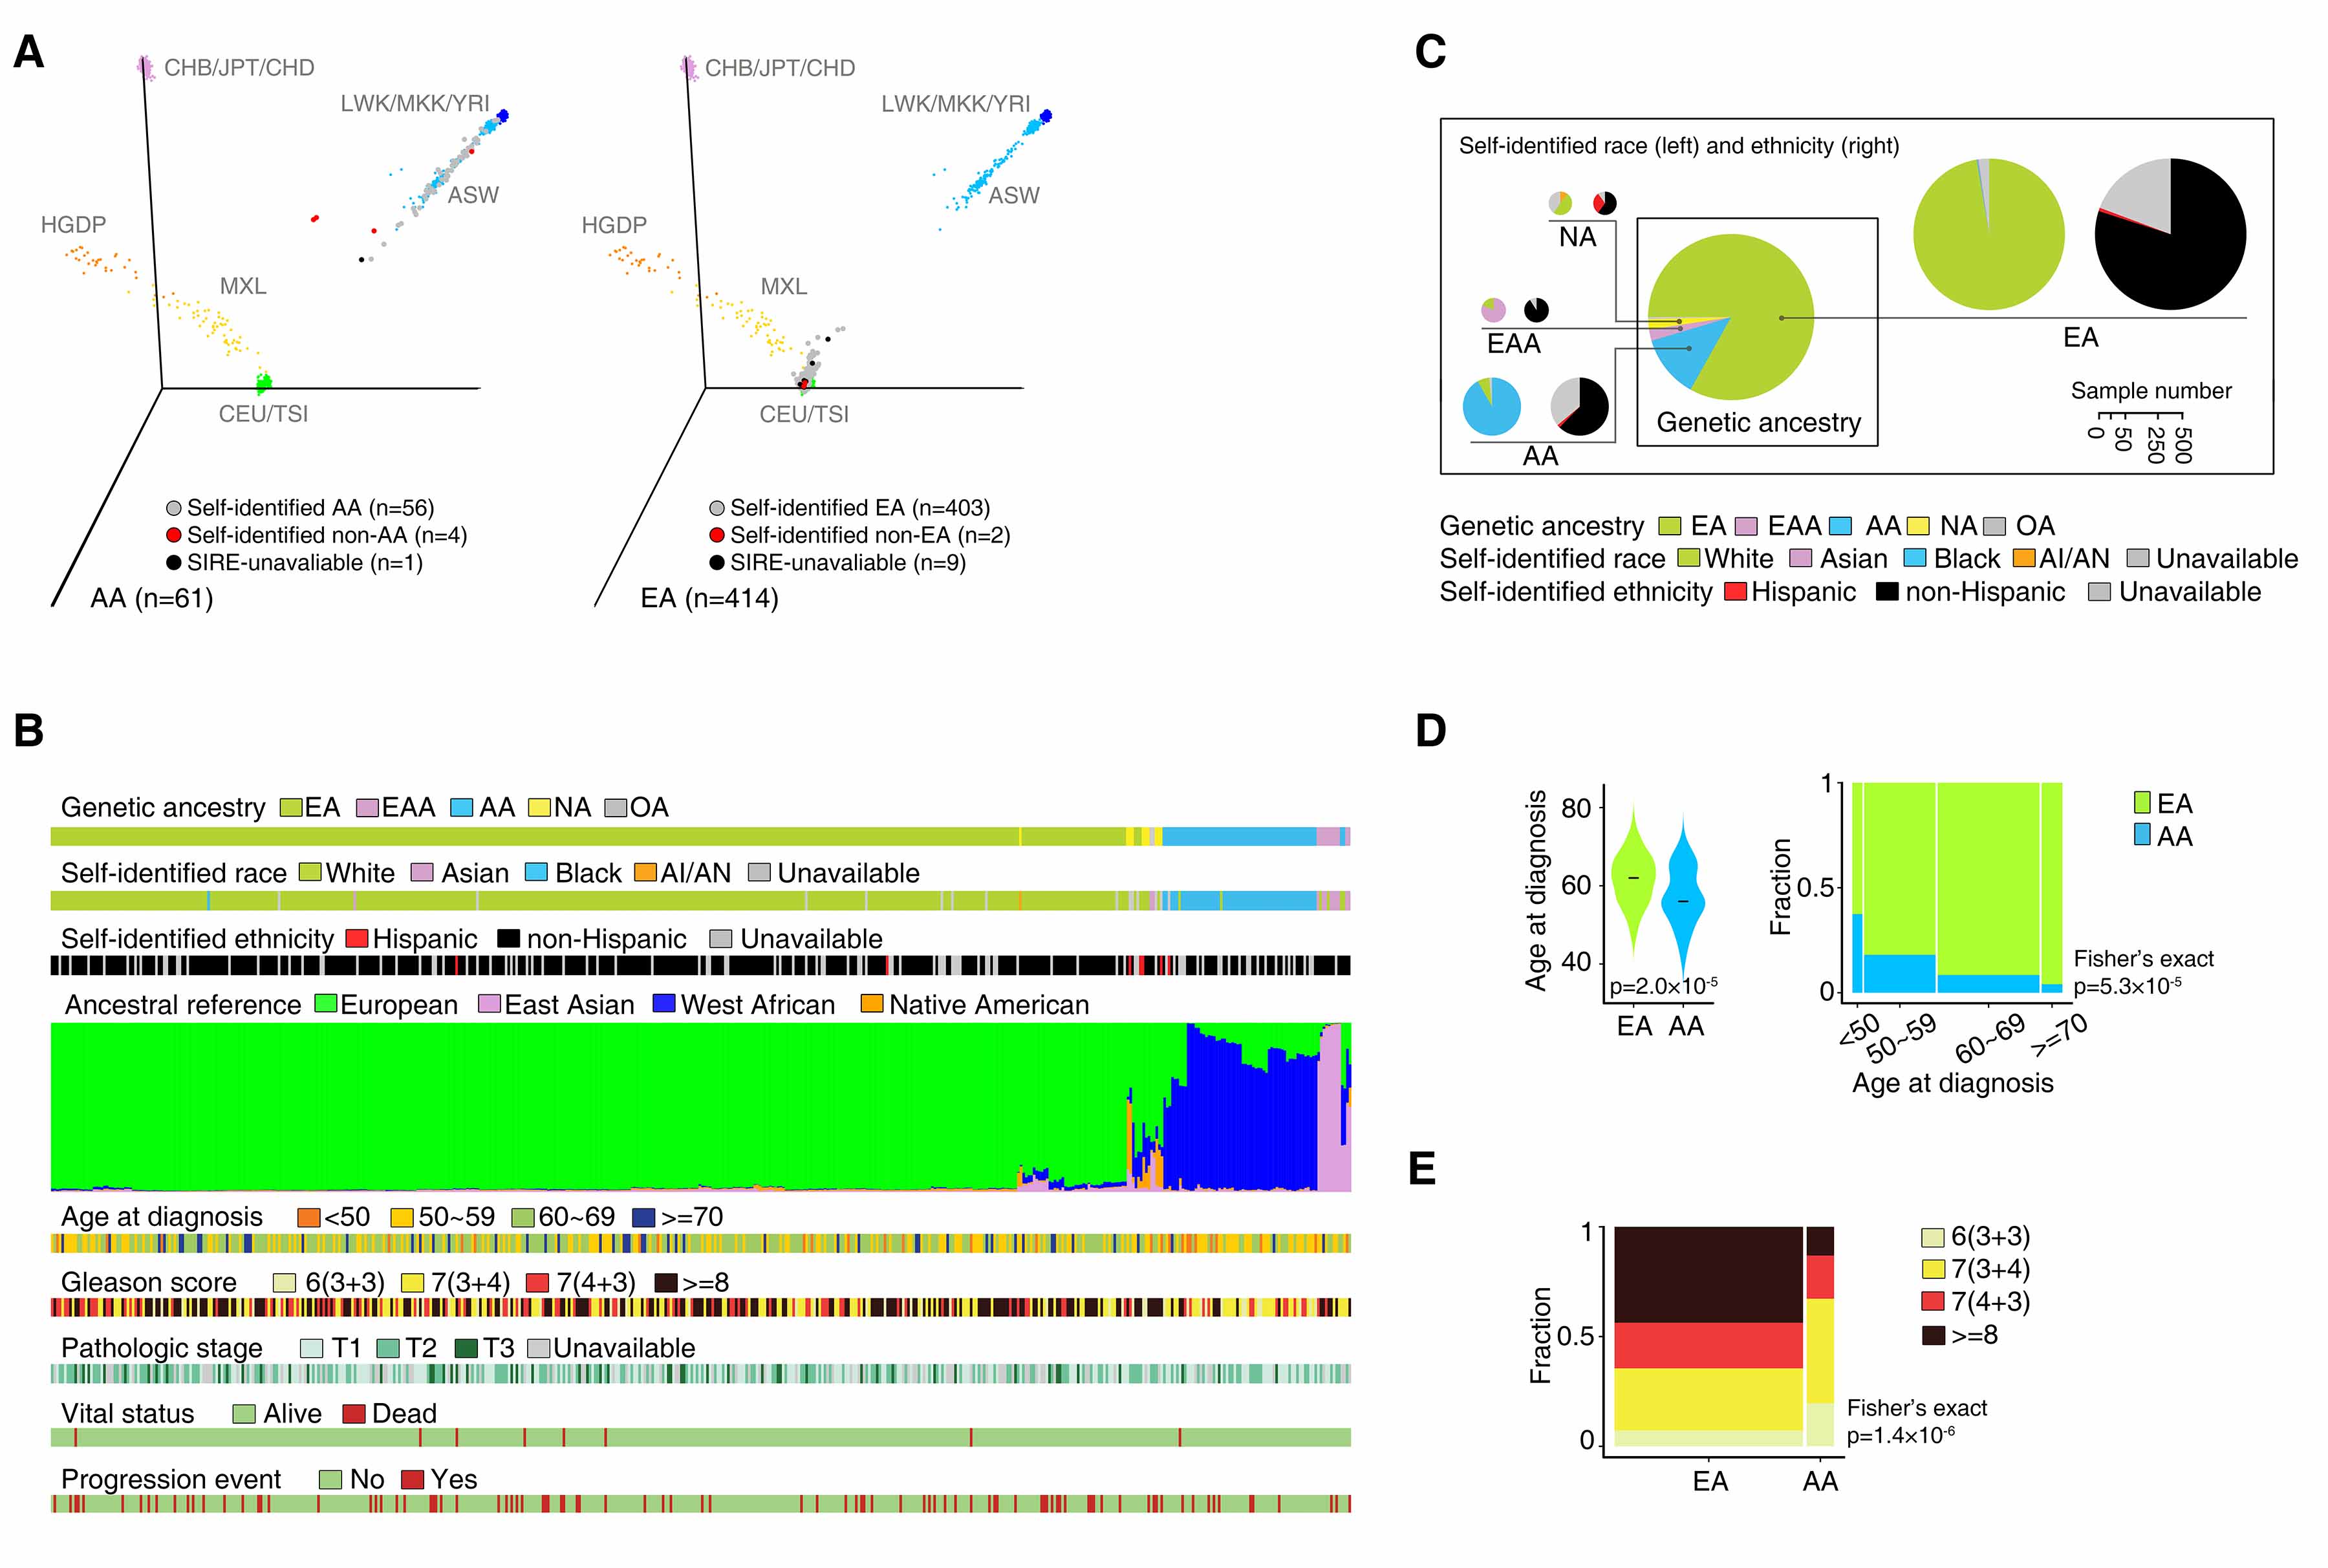
(A) Three-dimensional visualization of genetic variation of EA (left) and AA (right) individuals from the TCGA CaP sample and the reference populations from the HapMap and HGDP on the first three principle components calculated by EIGENSTRAT. Dot colors show concordance between inferred genetic ancestry and SIRE. (B) Pie charts showing agreement between inferred genetic ancestry by EIGENSTRAT and SIRE. Pie chart size is proportional to the number of individuals. (C) Genetic ancestry, SIRE, ancestral composition, and clinical characteristics of the patients in the TCGA CaP sample. Ancestral composition is inferred by STRUCTURE and each color represents an ancestral reference group. Individuals are ordered by hierarchical clustering using Ward’s methods on distance matrix calculated as cosine dissimilarity of genetic composition. (D) Distributions of age at diagnosis among men with AA and EA ancestry. (E) Distribution of Gleason score among men with AA and EA ancestry.
Copyright © 2015 University of Pennsylvania. All Rights Reserved.